 National Rehab Helpline
Key Numbers
- Listed treatment facilities
- 323closed listings excluded
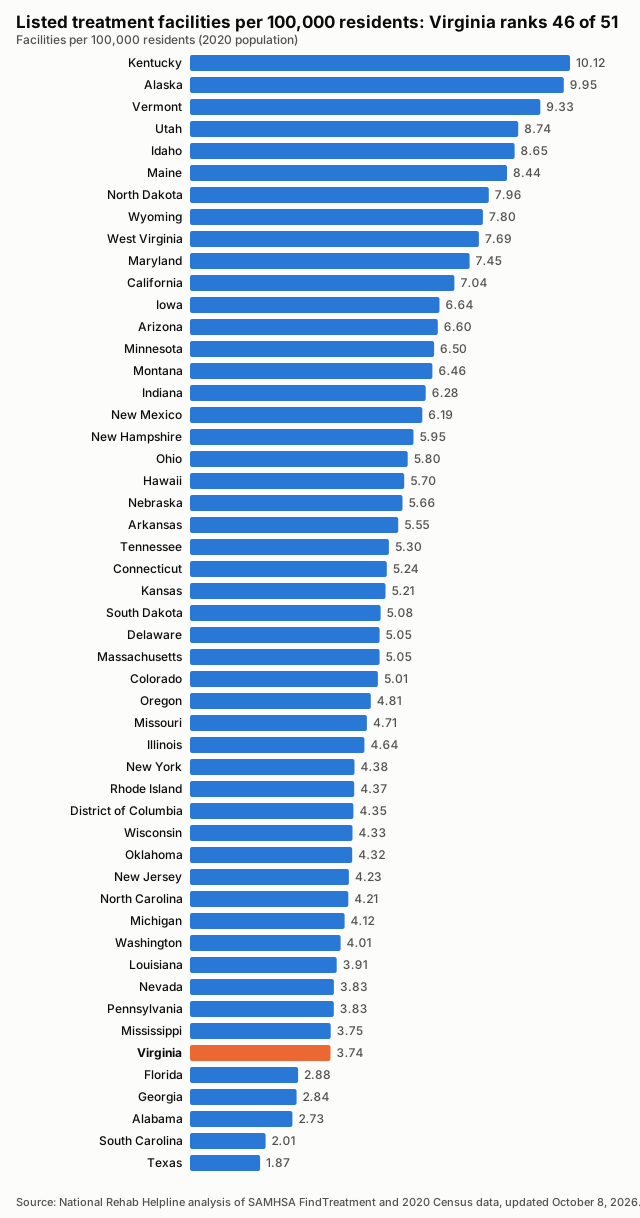
- Facilities per 100,000 residents
- 3.742020 Census population
- Treatment deserts
- 40of 133 counties have no listed facility
- Residents of treatment deserts
- 654,663people in zero-facility counties
- Accept Medicaid
- 89.8%290 of 323 listed facilities
- Population
- 8,631,3932020 Census
Last updated , when the source report was generated.
These figures count listed facilities, not capacity or quality: a listing does not show how many people a facility can treat, how soon, or how well.
How the State Compares
Treatment Deserts
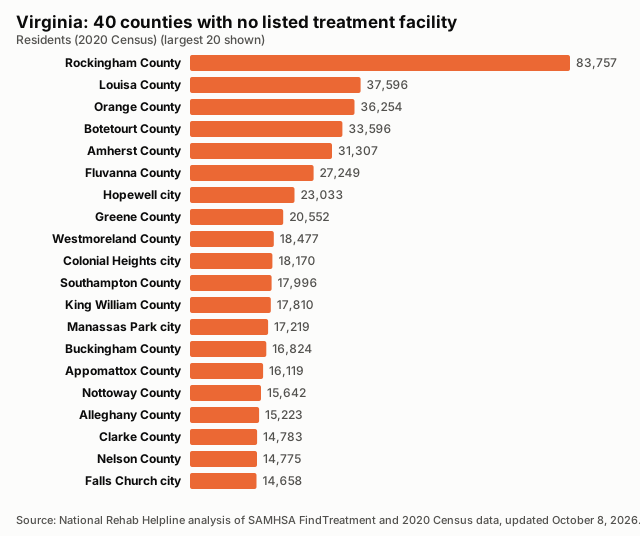
40 counties have no listed treatment facility. Distances are straight-line miles to the nearest listed facility.
| County | Population | Nearest listed facility (miles) |
|---|---|---|
| Rockingham County | 83,757 | 4.0 |
| Louisa County | 37,596 | 19.9 |
| Orange County | 36,254 | 14.2 |
| Botetourt County | 33,596 | 17.9 |
| Amherst County | 31,307 | 13.3 |
| Fluvanna County | 27,249 | 15.7 |
| Hopewell city | 23,033 | 2.8 |
| Greene County | 20,552 | 14.7 |
| Westmoreland County | 18,477 | 15.0 |
| Colonial Heights city | 18,170 | 2.1 |
| Southampton County | 17,996 | 10.3 |
| King William County | 17,810 | 11.8 |
| Manassas Park city | 17,219 | 2.0 |
| Buckingham County | 16,824 | 22.4 |
| Appomattox County | 16,119 | 18.6 |
| Nottoway County | 15,642 | 14.5 |
| Alleghany County | 15,223 | 1.1 |
| Clarke County | 14,783 | 8.8 |
| Nelson County | 14,775 | 19.3 |
| Falls Church city | 14,658 | 2.6 |
| Madison County | 13,837 | 14.4 |
| Poquoson city | 12,460 | 6.8 |
| Northampton County | 12,282 | 29.5 |
| Northumberland County | 11,839 | 5.7 |
| Sussex County | 10,829 | 17.5 |
| Middlesex County | 10,625 | 10.0 |
| Cumberland County | 9,675 | 17.4 |
| Richmond County | 8,923 | 8.4 |
| Mathews County | 8,533 | 13.9 |
| Rappahannock County | 7,348 | 15.1 |
| Lexington city | 7,320 | 1.8 |
| Charles City County | 6,773 | 5.6 |
| Buena Vista city | 6,641 | 6.3 |
| King and Queen County | 6,608 | 12.6 |
| Surry County | 6,561 | 14.2 |
| Bland County | 6,270 | 11.0 |
| Emporia city | 5,766 | 3.0 |
| Craig County | 4,892 | 15.9 |
| Bath County | 4,209 | 22.4 |
| Highland County | 2,232 | 30.3 |
Desert Counties by Population
Find Care Near Treatment Deserts
All Counties, Ranked
| Rank | County | Population | Listed facilities | Per 100,000 | Status |
|---|---|---|---|---|---|
| 1 | Norton city | 3,687 | 5 | 135.61 | |
| 2 | Galax city | 6,720 | 3 | 44.64 | |
| 3 | Martinsville city | 13,485 | 5 | 37.08 | |
| 4 | Winchester city | 28,120 | 8 | 28.45 | |
| 5 | Franklin city | 8,180 | 2 | 24.45 | |
| 6 | Buchanan County | 20,355 | 4 | 19.65 | |
| 7 | Essex County | 10,599 | 2 | 18.87 | |
| 8 | Lancaster County | 10,919 | 2 | 18.32 | |
| 9 | Lee County | 22,173 | 4 | 18.04 | |
| 10 | Covington city | 5,737 | 1 | 17.43 | |
| 11 | Salem city | 25,346 | 4 | 15.78 | |
| 12 | Danville city | 42,590 | 5 | 11.74 | |
| 13 | Bristol city | 17,219 | 2 | 11.62 | |
| 14 | Carroll County | 29,155 | 3 | 10.29 | |
| 15 | Roanoke city | 100,011 | 10 | 10.00 | |
| 16 | Frederick County | 91,419 | 9 | 9.84 | |
| 17 | Culpeper County | 52,552 | 5 | 9.51 | |
| 18 | Scott County | 21,576 | 2 | 9.27 | |
| 19 | Petersburg city | 33,458 | 3 | 8.97 | |
| 20 | Pulaski County | 33,800 | 3 | 8.88 | |
| 21 | Greensville County | 11,391 | 1 | 8.78 | |
| 22 | Charlotte County | 11,529 | 1 | 8.67 | |
| 23 | Page County | 23,709 | 2 | 8.44 | |
| 24 | Lunenburg County | 11,936 | 1 | 8.38 | |
| 25 | Wise County | 36,130 | 3 | 8.30 | |
| 26 | Staunton city | 25,750 | 2 | 7.77 | |
| 27 | Russell County | 25,781 | 2 | 7.76 | |
| 28 | Lynchburg city | 79,009 | 6 | 7.59 | |
| 29 | Amelia County | 13,265 | 1 | 7.54 | |
| 30 | Tazewell County | 40,429 | 3 | 7.42 | |
| 31 | Warren County | 40,727 | 3 | 7.37 | |
| 32 | Fredericksburg city | 27,982 | 2 | 7.15 | |
| 33 | Dickenson County | 14,124 | 1 | 7.08 | |
| 34 | Wythe County | 28,290 | 2 | 7.07 | |
| 35 | Manassas city | 42,772 | 3 | 7.01 | |
| 36 | Prince George County | 43,010 | 3 | 6.98 | |
| 37 | Smyth County | 29,800 | 2 | 6.71 | |
| 38 | Mecklenburg County | 30,319 | 2 | 6.60 | |
| 39 | Grayson County | 15,333 | 1 | 6.52 | |
| 40 | Williamsburg city | 15,425 | 1 | 6.48 | |
| 41 | Caroline County | 30,887 | 2 | 6.48 | |
| 42 | Floyd County | 15,476 | 1 | 6.46 | |
| 43 | Suffolk city | 94,324 | 6 | 6.36 | |
| 44 | Brunswick County | 15,849 | 1 | 6.31 | |
| 45 | Henrico County | 334,389 | 21 | 6.28 | |
| 46 | Radford city | 16,070 | 1 | 6.22 | |
| 47 | Accomack County | 33,413 | 2 | 5.99 | |
| 48 | Giles County | 16,787 | 1 | 5.96 | |
| 49 | Halifax County | 34,022 | 2 | 5.88 | |
| 50 | Harrisonburg city | 51,814 | 3 | 5.79 | |
| 51 | Patrick County | 17,608 | 1 | 5.68 | |
| 52 | Isle of Wight County | 38,606 | 2 | 5.18 | |
| 53 | Gloucester County | 38,711 | 2 | 5.17 | |
| 54 | Pittsylvania County | 60,501 | 3 | 4.96 | |
| 55 | Prince Edward County | 21,849 | 1 | 4.58 | |
| 56 | Hanover County | 109,979 | 5 | 4.55 | |
| 57 | Shenandoah County | 44,186 | 2 | 4.53 | |
| 58 | Waynesboro city | 22,196 | 1 | 4.51 | |
| 59 | Albemarle County | 112,395 | 5 | 4.45 | |
| 60 | Rockbridge County | 22,650 | 1 | 4.42 | |
| 61 | New Kent County | 22,945 | 1 | 4.36 | |
| 62 | York County | 70,045 | 3 | 4.28 | |
| 63 | Arlington County | 238,643 | 10 | 4.19 | |
| 64 | Fairfax city | 24,146 | 1 | 4.14 | |
| 65 | Goochland County | 24,727 | 1 | 4.04 | |
| 66 | Montgomery County | 99,721 | 4 | 4.01 | |
| 67 | James City County | 78,254 | 3 | 3.83 | |
| 68 | Bedford County | 79,462 | 3 | 3.78 | |
| 69 | King George County | 26,723 | 1 | 3.74 | |
| 70 | Washington County | 53,935 | 2 | 3.71 | |
| 71 | Franklin County | 54,477 | 2 | 3.67 | |
| 72 | Dinwiddie County | 27,947 | 1 | 3.58 | |
| 73 | Norfolk city | 238,005 | 8 | 3.36 | |
| 74 | Powhatan County | 30,333 | 1 | 3.30 | |
| 75 | Hampton city | 137,148 | 4 | 2.92 | |
| 76 | Spotsylvania County | 140,032 | 4 | 2.86 | |
| 77 | Chesapeake city | 249,422 | 6 | 2.41 | |
| 78 | Virginia Beach city | 459,470 | 11 | 2.39 | |
| 79 | Loudoun County | 420,959 | 10 | 2.38 | |
| 80 | Richmond city | 226,610 | 5 | 2.21 | |
| 81 | Chesterfield County | 364,548 | 8 | 2.19 | |
| 82 | Charlottesville city | 46,553 | 1 | 2.15 | |
| 83 | Newport News city | 186,247 | 4 | 2.15 | |
| 84 | Roanoke County | 96,929 | 2 | 2.06 | |
| 85 | Henry County | 50,948 | 1 | 1.96 | |
| 86 | Fairfax County | 1,150,309 | 22 | 1.91 | |
| 87 | Alexandria city | 159,467 | 3 | 1.88 | |
| 88 | Campbell County | 55,696 | 1 | 1.80 | |
| 89 | Prince William County | 482,204 | 8 | 1.66 | |
| 90 | Fauquier County | 72,972 | 1 | 1.37 | |
| 91 | Augusta County | 77,487 | 1 | 1.29 | |
| 92 | Stafford County | 156,927 | 2 | 1.27 | |
| 93 | Portsmouth city | 97,915 | 1 | 1.02 | |
| 94 | Alleghany County | 15,223 | 0 | 0.00 | Treatment desert |
| 95 | Amherst County | 31,307 | 0 | 0.00 | Treatment desert |
| 96 | Appomattox County | 16,119 | 0 | 0.00 | Treatment desert |
| 97 | Bath County | 4,209 | 0 | 0.00 | Treatment desert |
| 98 | Bland County | 6,270 | 0 | 0.00 | Treatment desert |
| 99 | Botetourt County | 33,596 | 0 | 0.00 | Treatment desert |
| 100 | Buckingham County | 16,824 | 0 | 0.00 | Treatment desert |
| 101 | Buena Vista city | 6,641 | 0 | 0.00 | Treatment desert |
| 102 | Charles City County | 6,773 | 0 | 0.00 | Treatment desert |
| 103 | Clarke County | 14,783 | 0 | 0.00 | Treatment desert |
| 104 | Colonial Heights city | 18,170 | 0 | 0.00 | Treatment desert |
| 105 | Craig County | 4,892 | 0 | 0.00 | Treatment desert |
| 106 | Cumberland County | 9,675 | 0 | 0.00 | Treatment desert |
| 107 | Emporia city | 5,766 | 0 | 0.00 | Treatment desert |
| 108 | Falls Church city | 14,658 | 0 | 0.00 | Treatment desert |
| 109 | Fluvanna County | 27,249 | 0 | 0.00 | Treatment desert |
| 110 | Greene County | 20,552 | 0 | 0.00 | Treatment desert |
| 111 | Highland County | 2,232 | 0 | 0.00 | Treatment desert |
| 112 | Hopewell city | 23,033 | 0 | 0.00 | Treatment desert |
| 113 | King William County | 17,810 | 0 | 0.00 | Treatment desert |
| 114 | King and Queen County | 6,608 | 0 | 0.00 | Treatment desert |
| 115 | Lexington city | 7,320 | 0 | 0.00 | Treatment desert |
| 116 | Louisa County | 37,596 | 0 | 0.00 | Treatment desert |
| 117 | Madison County | 13,837 | 0 | 0.00 | Treatment desert |
| 118 | Manassas Park city | 17,219 | 0 | 0.00 | Treatment desert |
| 119 | Mathews County | 8,533 | 0 | 0.00 | Treatment desert |
| 120 | Middlesex County | 10,625 | 0 | 0.00 | Treatment desert |
| 121 | Nelson County | 14,775 | 0 | 0.00 | Treatment desert |
| 122 | Northampton County | 12,282 | 0 | 0.00 | Treatment desert |
| 123 | Northumberland County | 11,839 | 0 | 0.00 | Treatment desert |
| 124 | Nottoway County | 15,642 | 0 | 0.00 | Treatment desert |
| 125 | Orange County | 36,254 | 0 | 0.00 | Treatment desert |
| 126 | Poquoson city | 12,460 | 0 | 0.00 | Treatment desert |
| 127 | Rappahannock County | 7,348 | 0 | 0.00 | Treatment desert |
| 128 | Richmond County | 8,923 | 0 | 0.00 | Treatment desert |
| 129 | Rockingham County | 83,757 | 0 | 0.00 | Treatment desert |
| 130 | Southampton County | 17,996 | 0 | 0.00 | Treatment desert |
| 131 | Surry County | 6,561 | 0 | 0.00 | Treatment desert |
| 132 | Sussex County | 10,829 | 0 | 0.00 | Treatment desert |
| 133 | Westmoreland County | 18,477 | 0 | 0.00 | Treatment desert |
Methodology
Every number on this page is calculated directly from public records; no figure is estimated or written by hand.
Facilities are the treatment locations listed in SAMHSA's FindTreatment.gov locator, each counted once by its listing ID. Closed listings are excluded; active and unconfirmed listings are included (unique IDs; closed excluded; active and unconfirmed included).
Density divides the number of listed facilities by the 2020 Census resident population and multiplies by 100,000.
A treatment desert is a county with zero listed facilities. Facilities are placed in counties by their coordinates against Census county boundaries; deserts are only reported when every listed facility in the state has a verified county.
The Medicaid share is the number of listed facilities that report accepting Medicaid divided by all listed facilities; facilities that do not report it count as not confirmed.
Distances are straight-line (great-circle) miles from a county's Census reference point to the nearest geocoded listed facility in any state. They are not driving distances.
These are listed facilities, not capacity or quality: counts describe listings, not beds, wait times, outcomes or proof of access to care.
Known Gaps in This Data
- None reported for this state.
Sources and Reuse
- SAMHSA FindTreatment.gov treatment locator (Substance Abuse and Mental Health Services Administration): Listed treatment facilities, operating status and Medicaid acceptance.
- 2020 Census redistricting data (P.L. 94-171), table P1 (U.S. Census Bureau): State and county resident population (2020).
- 2020 cartographic boundary files, counties (1:500,000) (U.S. Census Bureau): County boundaries for assigning facilities to counties and for the county map.
- 2020 Census Gazetteer files, counties (U.S. Census Bureau): County reference points for nearest-facility distances.
Download this data: County table (CSV) · Full data (JSON)
Licence: this data and its charts are published under the Creative Commons Attribution 4.0 (CC BY 4.0) licence. You may copy, share and adapt them, including commercially. Attribution: credit National Rehab Helpline and link to the source page, https://nationalrehabhelpline.com/data/virginia/.