 National Rehab Helpline
Key Numbers
- Listed treatment facilities
- 544closed listings excluded
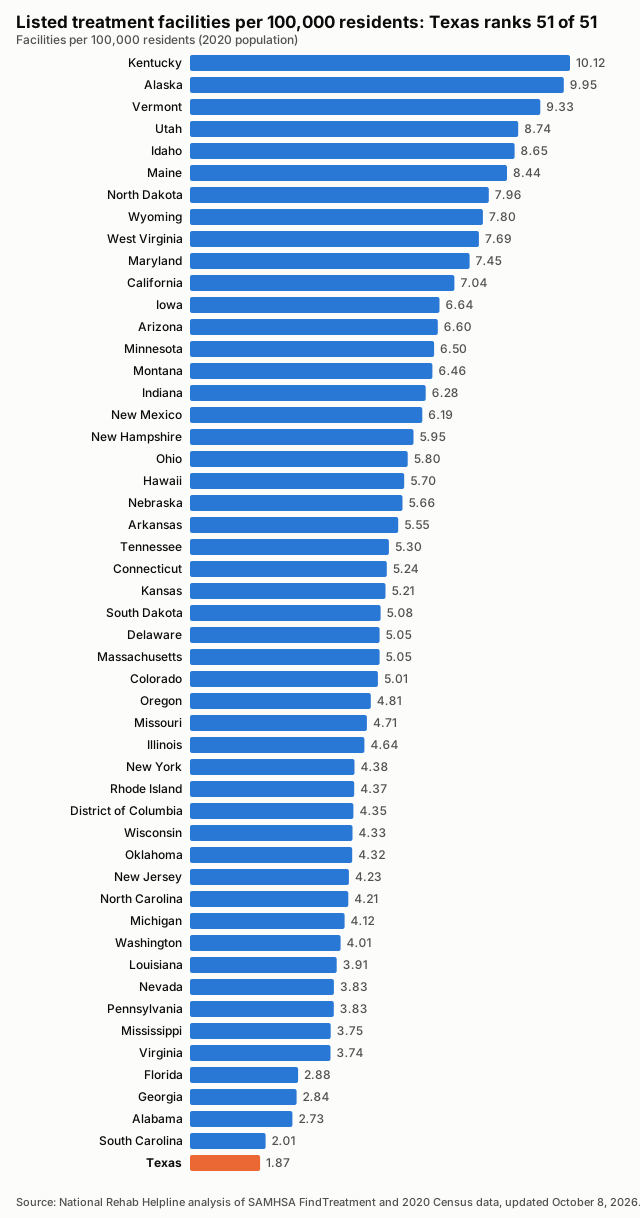
- Facilities per 100,000 residents
- 1.872020 Census population
- Treatment deserts
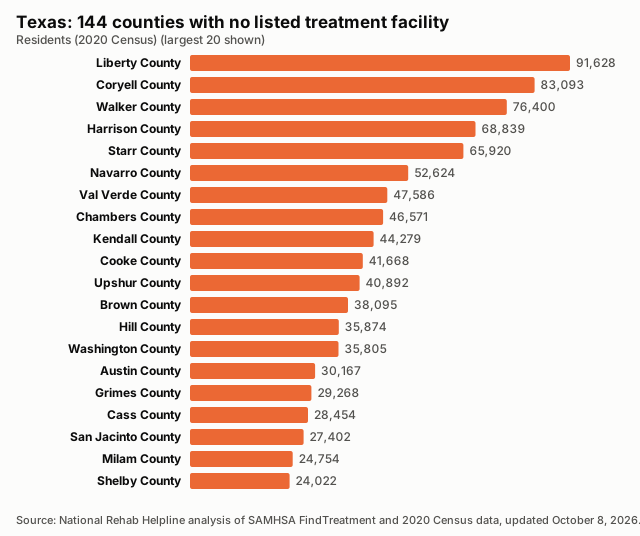
- 144of 254 counties have no listed facility
- Residents of treatment deserts
- 2,026,876people in zero-facility counties
- Accept Medicaid
- 69.3%377 of 544 listed facilities
- Population
- 29,145,5052020 Census
Last updated , when the source report was generated.
These figures count listed facilities, not capacity or quality: a listing does not show how many people a facility can treat, how soon, or how well.
How the State Compares
Treatment Deserts
144 counties have no listed treatment facility. Distances are straight-line miles to the nearest listed facility.
| County | Population | Nearest listed facility (miles) |
|---|---|---|
| Liberty County | 91,628 | 20.5 |
| Coryell County | 83,093 | 22.4 |
| Walker County | 76,400 | 29.4 |
| Harrison County | 68,839 | 20.6 |
| Starr County | 65,920 | 39.7 |
| Navarro County | 52,624 | 21.9 |
| Val Verde County | 47,586 | 88.9 |
| Chambers County | 46,571 | 18.3 |
| Kendall County | 44,279 | 19.1 |
| Cooke County | 41,668 | 29.2 |
| Upshur County | 40,892 | 17.8 |
| Brown County | 38,095 | 53.0 |
| Hill County | 35,874 | 25.1 |
| Washington County | 35,805 | 21.8 |
| Austin County | 30,167 | 18.4 |
| Grimes County | 29,268 | 18.2 |
| Cass County | 28,454 | 29.8 |
| San Jacinto County | 27,402 | 15.9 |
| Milam County | 24,754 | 29.0 |
| Shelby County | 24,022 | 18.4 |
| Aransas County | 23,830 | 27.5 |
| Panola County | 22,491 | 28.9 |
| Limestone County | 22,146 | 32.7 |
| Houston County | 22,066 | 30.6 |
| Lampasas County | 21,627 | 31.6 |
| Gaines County | 21,598 | 29.4 |
| Hockley County | 21,537 | 25.4 |
| Moore County | 21,358 | 42.6 |
| Llano County | 21,243 | 26.2 |
| Hutchinson County | 20,617 | 28.9 |
| Colorado County | 20,557 | 21.4 |
| Lavaca County | 20,337 | 33.0 |
| Willacy County | 20,164 | 18.9 |
| Calhoun County | 20,106 | 35.6 |
| Montague County | 19,965 | 31.5 |
| DeWitt County | 19,824 | 26.0 |
| Tyler County | 19,798 | 24.7 |
| Jones County | 19,663 | 21.2 |
| Freestone County | 19,435 | 31.1 |
| Andrews County | 18,610 | 35.4 |
| Bosque County | 18,235 | 34.5 |
| Young County | 17,867 | 39.8 |
| Eastland County | 17,725 | 35.3 |
| Burleson County | 17,642 | 19.1 |
| Falls County | 16,968 | 20.8 |
| Robertson County | 16,757 | 26.2 |
| Leon County | 15,719 | 37.4 |
| Jackson County | 14,988 | 26.3 |
| Reeves County | 14,748 | 52.2 |
| Callahan County | 13,708 | 22.3 |
| Trinity County | 13,602 | 28.4 |
| Comanche County | 13,594 | 24.4 |
| Madison County | 13,455 | 30.9 |
| Lamb County | 13,045 | 37.4 |
| Wilbarger County | 12,887 | 38.7 |
| Camp County | 12,464 | 13.5 |
| Dawson County | 12,456 | 44.0 |
| Newton County | 12,217 | 18.0 |
| Morris County | 11,973 | 15.0 |
| Terry County | 11,831 | 35.2 |
| Red River County | 11,587 | 22.7 |
| Live Oak County | 11,335 | 23.9 |
| Franklin County | 10,359 | 13.7 |
| Clay County | 10,218 | 18.5 |
| Ochiltree County | 10,015 | 46.5 |
| Sabine County | 9,894 | 20.5 |
| Parmer County | 9,869 | 25.3 |
| Duval County | 9,831 | 25.7 |
| Marion County | 9,725 | 29.4 |
| Somervell County | 9,205 | 15.3 |
| Stephens County | 9,101 | 41.0 |
| Archer County | 8,560 | 20.9 |
| Jack County | 8,472 | 29.6 |
| Hamilton County | 8,222 | 34.9 |
| Yoakum County | 7,694 | 36.1 |
| Coleman County | 7,684 | 36.3 |
| McCulloch County | 7,630 | 55.3 |
| Castro County | 7,371 | 21.2 |
| Dallam County | 7,115 | 68.3 |
| Brooks County | 7,076 | 41.0 |
| Goliad County | 7,012 | 26.6 |
| Swisher County | 6,971 | 18.8 |
| Bailey County | 6,904 | 30.1 |
| Refugio County | 6,741 | 27.6 |
| Childress County | 6,664 | 50.2 |
| Carson County | 5,807 | 24.4 |
| San Saba County | 5,730 | 50.1 |
| Lynn County | 5,596 | 24.9 |
| Haskell County | 5,416 | 50.1 |
| Floyd County | 5,402 | 24.5 |
| Hartley County | 5,382 | 58.9 |
| Hansford County | 5,285 | 29.8 |
| Martin County | 5,237 | 20.3 |
| Delta County | 5,230 | 16.2 |
| Crosby County | 5,133 | 29.3 |
| Wheeler County | 4,990 | 42.0 |
| Jim Hogg County | 4,838 | 33.7 |
| Crane County | 4,675 | 25.2 |
| Mills County | 4,456 | 52.6 |
| Mason County | 3,953 | 34.2 |
| Fisher County | 3,672 | 19.6 |
| Hardeman County | 3,549 | 33.6 |
| Baylor County | 3,465 | 43.4 |
| Reagan County | 3,385 | 45.1 |
| Hemphill County | 3,382 | 42.4 |
| Sutton County | 3,372 | 44.2 |
| Knox County | 3,353 | 71.8 |
| Concho County | 3,303 | 32.7 |
| Coke County | 3,285 | 30.7 |
| Donley County | 3,258 | 43.1 |
| Hudspeth County | 3,202 | 42.7 |
| Kinney County | 3,129 | 41.0 |
| Shackelford County | 3,105 | 29.1 |
| Crockett County | 3,098 | 56.6 |
| Lipscomb County | 3,059 | 43.9 |
| Hall County | 2,825 | 66.1 |
| Sherman County | 2,782 | 37.1 |
| Real County | 2,758 | 32.8 |
| Collingsworth County | 2,652 | 56.2 |
| Cochran County | 2,547 | 49.5 |
| Schleicher County | 2,451 | 38.4 |
| Jeff Davis County | 1,996 | 36.2 |
| Menard County | 1,962 | 28.0 |
| Armstrong County | 1,848 | 32.3 |
| Dickens County | 1,770 | 44.9 |
| Oldham County | 1,758 | 39.4 |
| Irion County | 1,513 | 30.9 |
| Throckmorton County | 1,440 | 57.6 |
| Briscoe County | 1,435 | 34.2 |
| Edwards County | 1,422 | 47.2 |
| Cottle County | 1,380 | 65.6 |
| Sterling County | 1,372 | 37.7 |
| Stonewall County | 1,245 | 49.8 |
| Glasscock County | 1,116 | 25.5 |
| Foard County | 1,095 | 54.2 |
| Motley County | 1,063 | 53.2 |
| Roberts County | 827 | 20.2 |
| Terrell County | 760 | 63.1 |
| Kent County | 753 | 33.4 |
| Borden County | 631 | 30.7 |
| McMullen County | 600 | 37.5 |
| Kenedy County | 350 | 46.5 |
| King County | 265 | 71.6 |
| Loving County | 64 | 27.4 |
Desert Counties by Population
Find Care Near Treatment Deserts
All Counties, Ranked
| Rank | County | Population | Listed facilities | Per 100,000 | Status |
|---|---|---|---|---|---|
| 1 | Culberson County | 2,188 | 1 | 45.70 | |
| 2 | Upton County | 3,308 | 1 | 30.23 | |
| 3 | Kimble County | 4,286 | 1 | 23.33 | |
| 4 | Dimmit County | 8,615 | 2 | 23.22 | |
| 5 | Garza County | 5,816 | 1 | 17.19 | |
| 6 | Presidio County | 6,131 | 1 | 16.31 | |
| 7 | La Salle County | 6,664 | 1 | 15.01 | |
| 8 | Winkler County | 7,791 | 1 | 12.84 | |
| 9 | San Augustine County | 7,918 | 1 | 12.63 | |
| 10 | Mitchell County | 8,990 | 1 | 11.12 | |
| 11 | Frio County | 18,385 | 2 | 10.88 | |
| 12 | Brewster County | 9,546 | 1 | 10.48 | |
| 13 | Zavala County | 9,670 | 1 | 10.34 | |
| 14 | Gonzales County | 19,653 | 2 | 10.18 | |
| 15 | Runnels County | 9,900 | 1 | 10.10 | |
| 16 | Blanco County | 11,374 | 1 | 8.79 | |
| 17 | Ward County | 11,644 | 1 | 8.59 | |
| 18 | Rains County | 12,164 | 1 | 8.22 | |
| 19 | Gillespie County | 26,725 | 2 | 7.48 | |
| 20 | Zapata County | 13,889 | 1 | 7.20 | |
| 21 | Waller County | 56,794 | 4 | 7.04 | |
| 22 | Karnes County | 14,710 | 1 | 6.80 | |
| 23 | Nolan County | 14,738 | 1 | 6.79 | |
| 24 | Pecos County | 15,193 | 1 | 6.58 | |
| 25 | Hale County | 32,522 | 2 | 6.15 | |
| 26 | Scurry County | 16,932 | 1 | 5.91 | |
| 27 | Potter County | 118,525 | 7 | 5.91 | |
| 28 | Lee County | 17,478 | 1 | 5.72 | |
| 29 | Kerr County | 52,598 | 3 | 5.70 | |
| 30 | Deaf Smith County | 18,583 | 1 | 5.38 | |
| 31 | Maverick County | 57,887 | 3 | 5.18 | |
| 32 | Gregg County | 124,239 | 6 | 4.83 | |
| 33 | Bandera County | 20,851 | 1 | 4.80 | |
| 34 | Orange County | 84,808 | 4 | 4.72 | |
| 35 | Gray County | 21,227 | 1 | 4.71 | |
| 36 | Erath County | 42,545 | 2 | 4.70 | |
| 37 | Angelina County | 86,395 | 4 | 4.63 | |
| 38 | Caldwell County | 45,883 | 2 | 4.36 | |
| 39 | Kaufman County | 145,310 | 6 | 4.13 | |
| 40 | Fayette County | 24,435 | 1 | 4.09 | |
| 41 | Uvalde County | 24,564 | 1 | 4.07 | |
| 42 | Burnet County | 49,130 | 2 | 4.07 | |
| 43 | Wilson County | 49,753 | 2 | 4.02 | |
| 44 | Cherokee County | 50,412 | 2 | 3.97 | |
| 45 | Palo Pinto County | 28,409 | 1 | 3.52 | |
| 46 | Jefferson County | 256,526 | 9 | 3.51 | |
| 47 | Parker County | 148,222 | 5 | 3.37 | |
| 48 | Van Zandt County | 59,541 | 2 | 3.36 | |
| 49 | Tom Green County | 120,003 | 4 | 3.33 | |
| 50 | Victoria County | 91,319 | 3 | 3.29 | |
| 51 | Bowie County | 92,893 | 3 | 3.23 | |
| 52 | Kleberg County | 31,040 | 1 | 3.22 | |
| 53 | Bee County | 31,047 | 1 | 3.22 | |
| 54 | Lubbock County | 310,639 | 10 | 3.22 | |
| 55 | Titus County | 31,247 | 1 | 3.20 | |
| 56 | Nueces County | 353,178 | 11 | 3.11 | |
| 57 | Nacogdoches County | 64,653 | 2 | 3.09 | |
| 58 | Jasper County | 32,980 | 1 | 3.03 | |
| 59 | Grayson County | 135,543 | 4 | 2.95 | |
| 60 | Midland County | 169,983 | 5 | 2.94 | |
| 61 | San Patricio County | 68,755 | 2 | 2.91 | |
| 62 | Howard County | 34,860 | 1 | 2.87 | |
| 63 | Galveston County | 350,682 | 10 | 2.85 | |
| 64 | Fannin County | 35,662 | 1 | 2.80 | |
| 65 | Taylor County | 143,208 | 4 | 2.79 | |
| 66 | Matagorda County | 36,255 | 1 | 2.76 | |
| 67 | Hopkins County | 36,787 | 1 | 2.72 | |
| 68 | Brazoria County | 372,031 | 10 | 2.69 | |
| 69 | El Paso County | 865,657 | 23 | 2.66 | |
| 70 | Jim Wells County | 38,891 | 1 | 2.57 | |
| 71 | Ector County | 165,171 | 4 | 2.42 | |
| 72 | Wharton County | 41,570 | 1 | 2.41 | |
| 73 | Wood County | 44,843 | 1 | 2.23 | |
| 74 | Bastrop County | 97,216 | 2 | 2.06 | |
| 75 | Atascosa County | 48,981 | 1 | 2.04 | |
| 76 | Tarrant County | 2,110,640 | 43 | 2.04 | |
| 77 | Travis County | 1,290,188 | 26 | 2.02 | |
| 78 | Hunt County | 99,956 | 2 | 2.00 | |
| 79 | Lamar County | 50,088 | 1 | 2.00 | |
| 80 | Polk County | 50,123 | 1 | 2.00 | |
| 81 | Medina County | 50,748 | 1 | 1.97 | |
| 82 | Montgomery County | 620,443 | 12 | 1.93 | |
| 83 | McLennan County | 260,579 | 5 | 1.92 | |
| 84 | Rusk County | 52,214 | 1 | 1.92 | |
| 85 | Webb County | 267,114 | 5 | 1.87 | |
| 86 | Rockwall County | 107,819 | 2 | 1.85 | |
| 87 | Hardin County | 56,231 | 1 | 1.78 | |
| 88 | Anderson County | 57,922 | 1 | 1.73 | |
| 89 | Smith County | 233,479 | 4 | 1.71 | |
| 90 | Brazos County | 233,849 | 4 | 1.71 | |
| 91 | Johnson County | 179,927 | 3 | 1.67 | |
| 92 | Hays County | 241,067 | 4 | 1.66 | |
| 93 | Harris County | 4,731,145 | 78 | 1.65 | |
| 94 | Williamson County | 609,017 | 10 | 1.64 | |
| 95 | Hood County | 61,598 | 1 | 1.62 | |
| 96 | Bell County | 370,647 | 6 | 1.62 | |
| 97 | Wichita County | 129,350 | 2 | 1.55 | |
| 98 | Denton County | 906,422 | 14 | 1.54 | |
| 99 | Wise County | 68,632 | 1 | 1.46 | |
| 100 | Bexar County | 2,009,324 | 29 | 1.44 | |
| 101 | Cameron County | 421,017 | 6 | 1.43 | |
| 102 | Collin County | 1,064,465 | 15 | 1.41 | |
| 103 | Dallas County | 2,613,539 | 35 | 1.34 | |
| 104 | Comal County | 161,501 | 2 | 1.24 | |
| 105 | Henderson County | 82,150 | 1 | 1.22 | |
| 106 | Guadalupe County | 172,706 | 2 | 1.16 | |
| 107 | Ellis County | 192,455 | 2 | 1.04 | |
| 108 | Fort Bend County | 822,779 | 8 | 0.97 | |
| 109 | Randall County | 140,753 | 1 | 0.71 | |
| 110 | Hidalgo County | 870,781 | 6 | 0.69 | |
| 111 | Andrews County | 18,610 | 0 | 0.00 | Treatment desert |
| 112 | Aransas County | 23,830 | 0 | 0.00 | Treatment desert |
| 113 | Archer County | 8,560 | 0 | 0.00 | Treatment desert |
| 114 | Armstrong County | 1,848 | 0 | 0.00 | Treatment desert |
| 115 | Austin County | 30,167 | 0 | 0.00 | Treatment desert |
| 116 | Bailey County | 6,904 | 0 | 0.00 | Treatment desert |
| 117 | Baylor County | 3,465 | 0 | 0.00 | Treatment desert |
| 118 | Borden County | 631 | 0 | 0.00 | Treatment desert |
| 119 | Bosque County | 18,235 | 0 | 0.00 | Treatment desert |
| 120 | Briscoe County | 1,435 | 0 | 0.00 | Treatment desert |
| 121 | Brooks County | 7,076 | 0 | 0.00 | Treatment desert |
| 122 | Brown County | 38,095 | 0 | 0.00 | Treatment desert |
| 123 | Burleson County | 17,642 | 0 | 0.00 | Treatment desert |
| 124 | Calhoun County | 20,106 | 0 | 0.00 | Treatment desert |
| 125 | Callahan County | 13,708 | 0 | 0.00 | Treatment desert |
| 126 | Camp County | 12,464 | 0 | 0.00 | Treatment desert |
| 127 | Carson County | 5,807 | 0 | 0.00 | Treatment desert |
| 128 | Cass County | 28,454 | 0 | 0.00 | Treatment desert |
| 129 | Castro County | 7,371 | 0 | 0.00 | Treatment desert |
| 130 | Chambers County | 46,571 | 0 | 0.00 | Treatment desert |
| 131 | Childress County | 6,664 | 0 | 0.00 | Treatment desert |
| 132 | Clay County | 10,218 | 0 | 0.00 | Treatment desert |
| 133 | Cochran County | 2,547 | 0 | 0.00 | Treatment desert |
| 134 | Coke County | 3,285 | 0 | 0.00 | Treatment desert |
| 135 | Coleman County | 7,684 | 0 | 0.00 | Treatment desert |
| 136 | Collingsworth County | 2,652 | 0 | 0.00 | Treatment desert |
| 137 | Colorado County | 20,557 | 0 | 0.00 | Treatment desert |
| 138 | Comanche County | 13,594 | 0 | 0.00 | Treatment desert |
| 139 | Concho County | 3,303 | 0 | 0.00 | Treatment desert |
| 140 | Cooke County | 41,668 | 0 | 0.00 | Treatment desert |
| 141 | Coryell County | 83,093 | 0 | 0.00 | Treatment desert |
| 142 | Cottle County | 1,380 | 0 | 0.00 | Treatment desert |
| 143 | Crane County | 4,675 | 0 | 0.00 | Treatment desert |
| 144 | Crockett County | 3,098 | 0 | 0.00 | Treatment desert |
| 145 | Crosby County | 5,133 | 0 | 0.00 | Treatment desert |
| 146 | Dallam County | 7,115 | 0 | 0.00 | Treatment desert |
| 147 | Dawson County | 12,456 | 0 | 0.00 | Treatment desert |
| 148 | DeWitt County | 19,824 | 0 | 0.00 | Treatment desert |
| 149 | Delta County | 5,230 | 0 | 0.00 | Treatment desert |
| 150 | Dickens County | 1,770 | 0 | 0.00 | Treatment desert |
| 151 | Donley County | 3,258 | 0 | 0.00 | Treatment desert |
| 152 | Duval County | 9,831 | 0 | 0.00 | Treatment desert |
| 153 | Eastland County | 17,725 | 0 | 0.00 | Treatment desert |
| 154 | Edwards County | 1,422 | 0 | 0.00 | Treatment desert |
| 155 | Falls County | 16,968 | 0 | 0.00 | Treatment desert |
| 156 | Fisher County | 3,672 | 0 | 0.00 | Treatment desert |
| 157 | Floyd County | 5,402 | 0 | 0.00 | Treatment desert |
| 158 | Foard County | 1,095 | 0 | 0.00 | Treatment desert |
| 159 | Franklin County | 10,359 | 0 | 0.00 | Treatment desert |
| 160 | Freestone County | 19,435 | 0 | 0.00 | Treatment desert |
| 161 | Gaines County | 21,598 | 0 | 0.00 | Treatment desert |
| 162 | Glasscock County | 1,116 | 0 | 0.00 | Treatment desert |
| 163 | Goliad County | 7,012 | 0 | 0.00 | Treatment desert |
| 164 | Grimes County | 29,268 | 0 | 0.00 | Treatment desert |
| 165 | Hall County | 2,825 | 0 | 0.00 | Treatment desert |
| 166 | Hamilton County | 8,222 | 0 | 0.00 | Treatment desert |
| 167 | Hansford County | 5,285 | 0 | 0.00 | Treatment desert |
| 168 | Hardeman County | 3,549 | 0 | 0.00 | Treatment desert |
| 169 | Harrison County | 68,839 | 0 | 0.00 | Treatment desert |
| 170 | Hartley County | 5,382 | 0 | 0.00 | Treatment desert |
| 171 | Haskell County | 5,416 | 0 | 0.00 | Treatment desert |
| 172 | Hemphill County | 3,382 | 0 | 0.00 | Treatment desert |
| 173 | Hill County | 35,874 | 0 | 0.00 | Treatment desert |
| 174 | Hockley County | 21,537 | 0 | 0.00 | Treatment desert |
| 175 | Houston County | 22,066 | 0 | 0.00 | Treatment desert |
| 176 | Hudspeth County | 3,202 | 0 | 0.00 | Treatment desert |
| 177 | Hutchinson County | 20,617 | 0 | 0.00 | Treatment desert |
| 178 | Irion County | 1,513 | 0 | 0.00 | Treatment desert |
| 179 | Jack County | 8,472 | 0 | 0.00 | Treatment desert |
| 180 | Jackson County | 14,988 | 0 | 0.00 | Treatment desert |
| 181 | Jeff Davis County | 1,996 | 0 | 0.00 | Treatment desert |
| 182 | Jim Hogg County | 4,838 | 0 | 0.00 | Treatment desert |
| 183 | Jones County | 19,663 | 0 | 0.00 | Treatment desert |
| 184 | Kendall County | 44,279 | 0 | 0.00 | Treatment desert |
| 185 | Kenedy County | 350 | 0 | 0.00 | Treatment desert |
| 186 | Kent County | 753 | 0 | 0.00 | Treatment desert |
| 187 | King County | 265 | 0 | 0.00 | Treatment desert |
| 188 | Kinney County | 3,129 | 0 | 0.00 | Treatment desert |
| 189 | Knox County | 3,353 | 0 | 0.00 | Treatment desert |
| 190 | Lamb County | 13,045 | 0 | 0.00 | Treatment desert |
| 191 | Lampasas County | 21,627 | 0 | 0.00 | Treatment desert |
| 192 | Lavaca County | 20,337 | 0 | 0.00 | Treatment desert |
| 193 | Leon County | 15,719 | 0 | 0.00 | Treatment desert |
| 194 | Liberty County | 91,628 | 0 | 0.00 | Treatment desert |
| 195 | Limestone County | 22,146 | 0 | 0.00 | Treatment desert |
| 196 | Lipscomb County | 3,059 | 0 | 0.00 | Treatment desert |
| 197 | Live Oak County | 11,335 | 0 | 0.00 | Treatment desert |
| 198 | Llano County | 21,243 | 0 | 0.00 | Treatment desert |
| 199 | Loving County | 64 | 0 | 0.00 | Treatment desert |
| 200 | Lynn County | 5,596 | 0 | 0.00 | Treatment desert |
| 201 | Madison County | 13,455 | 0 | 0.00 | Treatment desert |
| 202 | Marion County | 9,725 | 0 | 0.00 | Treatment desert |
| 203 | Martin County | 5,237 | 0 | 0.00 | Treatment desert |
| 204 | Mason County | 3,953 | 0 | 0.00 | Treatment desert |
| 205 | McCulloch County | 7,630 | 0 | 0.00 | Treatment desert |
| 206 | McMullen County | 600 | 0 | 0.00 | Treatment desert |
| 207 | Menard County | 1,962 | 0 | 0.00 | Treatment desert |
| 208 | Milam County | 24,754 | 0 | 0.00 | Treatment desert |
| 209 | Mills County | 4,456 | 0 | 0.00 | Treatment desert |
| 210 | Montague County | 19,965 | 0 | 0.00 | Treatment desert |
| 211 | Moore County | 21,358 | 0 | 0.00 | Treatment desert |
| 212 | Morris County | 11,973 | 0 | 0.00 | Treatment desert |
| 213 | Motley County | 1,063 | 0 | 0.00 | Treatment desert |
| 214 | Navarro County | 52,624 | 0 | 0.00 | Treatment desert |
| 215 | Newton County | 12,217 | 0 | 0.00 | Treatment desert |
| 216 | Ochiltree County | 10,015 | 0 | 0.00 | Treatment desert |
| 217 | Oldham County | 1,758 | 0 | 0.00 | Treatment desert |
| 218 | Panola County | 22,491 | 0 | 0.00 | Treatment desert |
| 219 | Parmer County | 9,869 | 0 | 0.00 | Treatment desert |
| 220 | Reagan County | 3,385 | 0 | 0.00 | Treatment desert |
| 221 | Real County | 2,758 | 0 | 0.00 | Treatment desert |
| 222 | Red River County | 11,587 | 0 | 0.00 | Treatment desert |
| 223 | Reeves County | 14,748 | 0 | 0.00 | Treatment desert |
| 224 | Refugio County | 6,741 | 0 | 0.00 | Treatment desert |
| 225 | Roberts County | 827 | 0 | 0.00 | Treatment desert |
| 226 | Robertson County | 16,757 | 0 | 0.00 | Treatment desert |
| 227 | Sabine County | 9,894 | 0 | 0.00 | Treatment desert |
| 228 | San Jacinto County | 27,402 | 0 | 0.00 | Treatment desert |
| 229 | San Saba County | 5,730 | 0 | 0.00 | Treatment desert |
| 230 | Schleicher County | 2,451 | 0 | 0.00 | Treatment desert |
| 231 | Shackelford County | 3,105 | 0 | 0.00 | Treatment desert |
| 232 | Shelby County | 24,022 | 0 | 0.00 | Treatment desert |
| 233 | Sherman County | 2,782 | 0 | 0.00 | Treatment desert |
| 234 | Somervell County | 9,205 | 0 | 0.00 | Treatment desert |
| 235 | Starr County | 65,920 | 0 | 0.00 | Treatment desert |
| 236 | Stephens County | 9,101 | 0 | 0.00 | Treatment desert |
| 237 | Sterling County | 1,372 | 0 | 0.00 | Treatment desert |
| 238 | Stonewall County | 1,245 | 0 | 0.00 | Treatment desert |
| 239 | Sutton County | 3,372 | 0 | 0.00 | Treatment desert |
| 240 | Swisher County | 6,971 | 0 | 0.00 | Treatment desert |
| 241 | Terrell County | 760 | 0 | 0.00 | Treatment desert |
| 242 | Terry County | 11,831 | 0 | 0.00 | Treatment desert |
| 243 | Throckmorton County | 1,440 | 0 | 0.00 | Treatment desert |
| 244 | Trinity County | 13,602 | 0 | 0.00 | Treatment desert |
| 245 | Tyler County | 19,798 | 0 | 0.00 | Treatment desert |
| 246 | Upshur County | 40,892 | 0 | 0.00 | Treatment desert |
| 247 | Val Verde County | 47,586 | 0 | 0.00 | Treatment desert |
| 248 | Walker County | 76,400 | 0 | 0.00 | Treatment desert |
| 249 | Washington County | 35,805 | 0 | 0.00 | Treatment desert |
| 250 | Wheeler County | 4,990 | 0 | 0.00 | Treatment desert |
| 251 | Wilbarger County | 12,887 | 0 | 0.00 | Treatment desert |
| 252 | Willacy County | 20,164 | 0 | 0.00 | Treatment desert |
| 253 | Yoakum County | 7,694 | 0 | 0.00 | Treatment desert |
| 254 | Young County | 17,867 | 0 | 0.00 | Treatment desert |
Methodology
Every number on this page is calculated directly from public records; no figure is estimated or written by hand.
Facilities are the treatment locations listed in SAMHSA's FindTreatment.gov locator, each counted once by its listing ID. Closed listings are excluded; active and unconfirmed listings are included (unique IDs; closed excluded; active and unconfirmed included).
Density divides the number of listed facilities by the 2020 Census resident population and multiplies by 100,000.
A treatment desert is a county with zero listed facilities. Facilities are placed in counties by their coordinates against Census county boundaries; deserts are only reported when every listed facility in the state has a verified county.
The Medicaid share is the number of listed facilities that report accepting Medicaid divided by all listed facilities; facilities that do not report it count as not confirmed.
Distances are straight-line (great-circle) miles from a county's Census reference point to the nearest geocoded listed facility in any state. They are not driving distances.
These are listed facilities, not capacity or quality: counts describe listings, not beds, wait times, outcomes or proof of access to care.
Known Gaps in This Data
- None reported for this state.
Sources and Reuse
- SAMHSA FindTreatment.gov treatment locator (Substance Abuse and Mental Health Services Administration): Listed treatment facilities, operating status and Medicaid acceptance.
- 2020 Census redistricting data (P.L. 94-171), table P1 (U.S. Census Bureau): State and county resident population (2020).
- 2020 cartographic boundary files, counties (1:500,000) (U.S. Census Bureau): County boundaries for assigning facilities to counties and for the county map.
- 2020 Census Gazetteer files, counties (U.S. Census Bureau): County reference points for nearest-facility distances.
Download this data: County table (CSV) · Full data (JSON)
Licence: this data and its charts are published under the Creative Commons Attribution 4.0 (CC BY 4.0) licence. You may copy, share and adapt them, including commercially. Attribution: credit National Rehab Helpline and link to the source page, https://nationalrehabhelpline.com/data/texas/.